Listing ID: 30622238
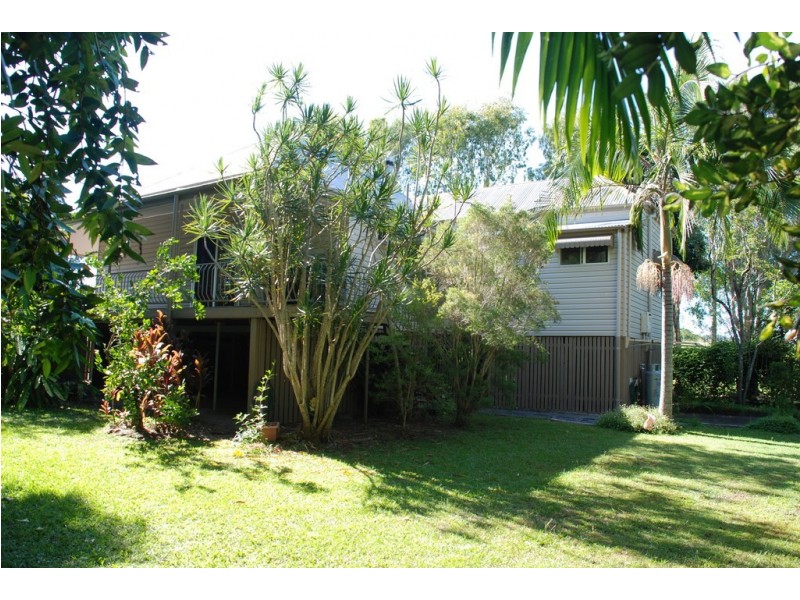
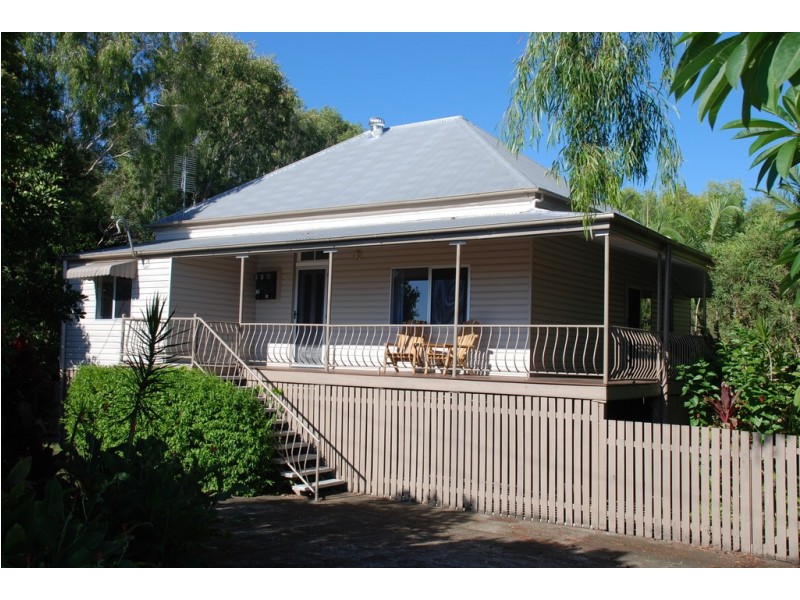
119 Commercial Road, Murwillumbah NSW 2484
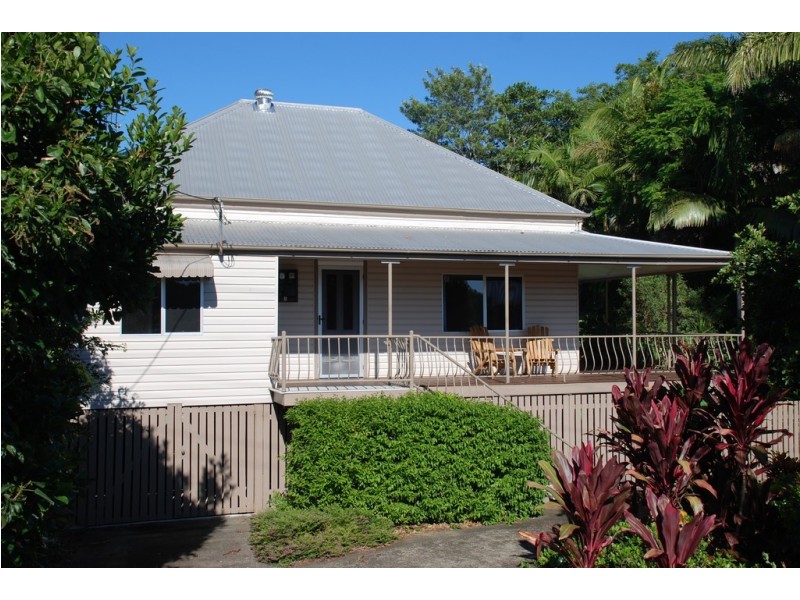
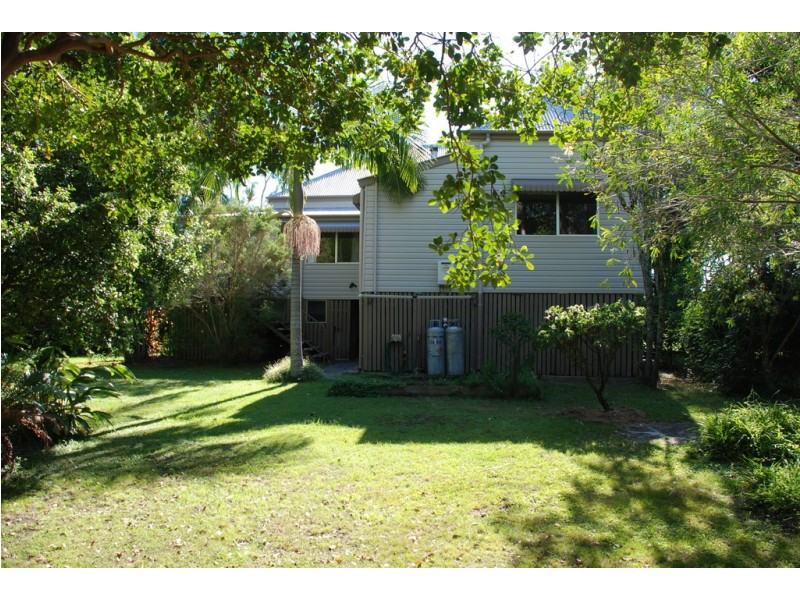
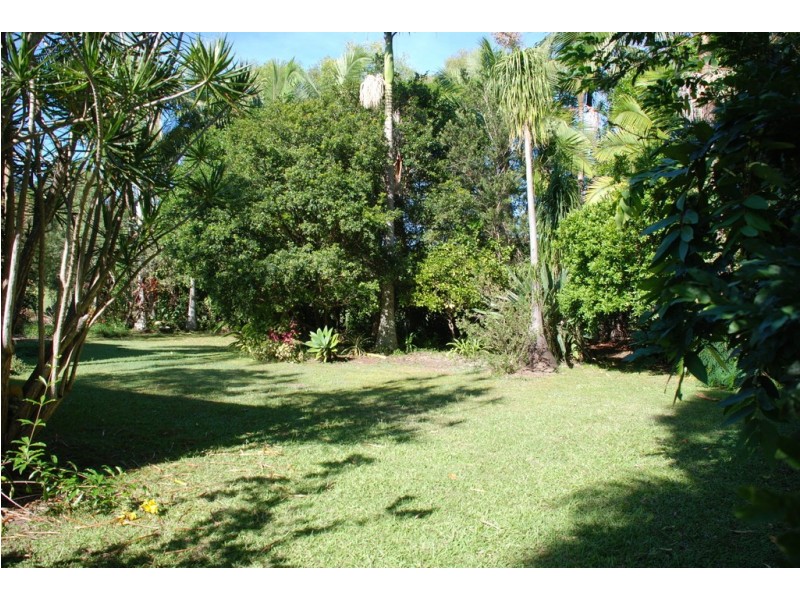
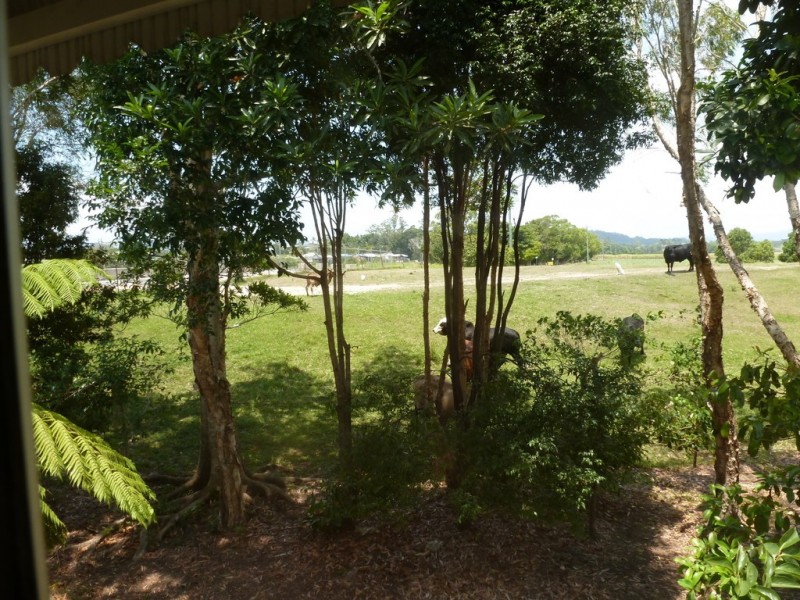
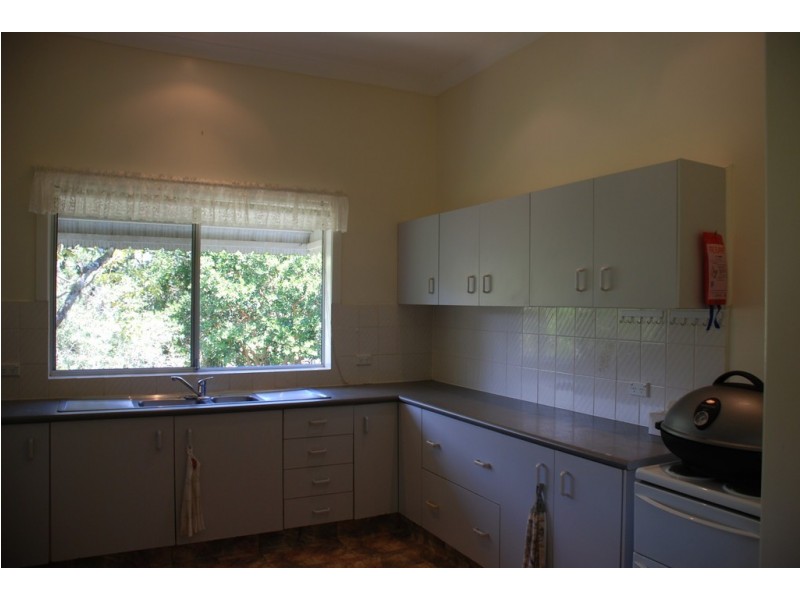
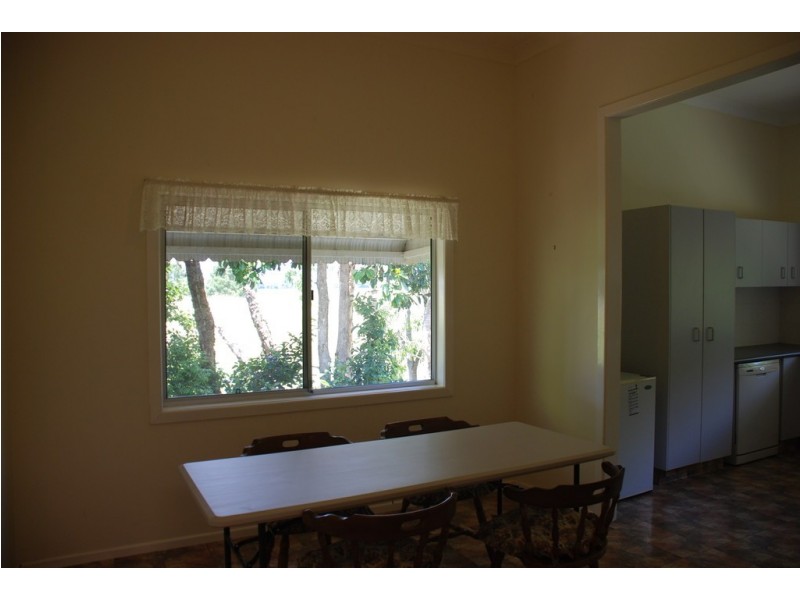
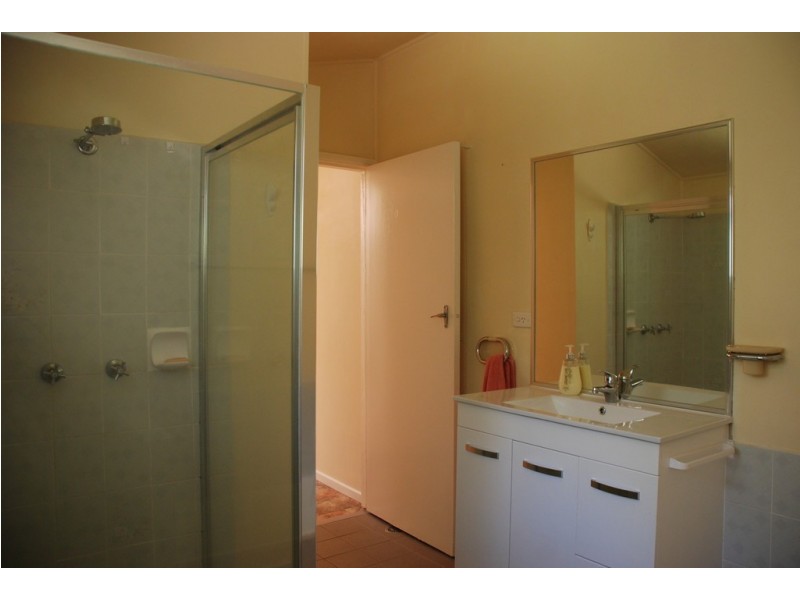
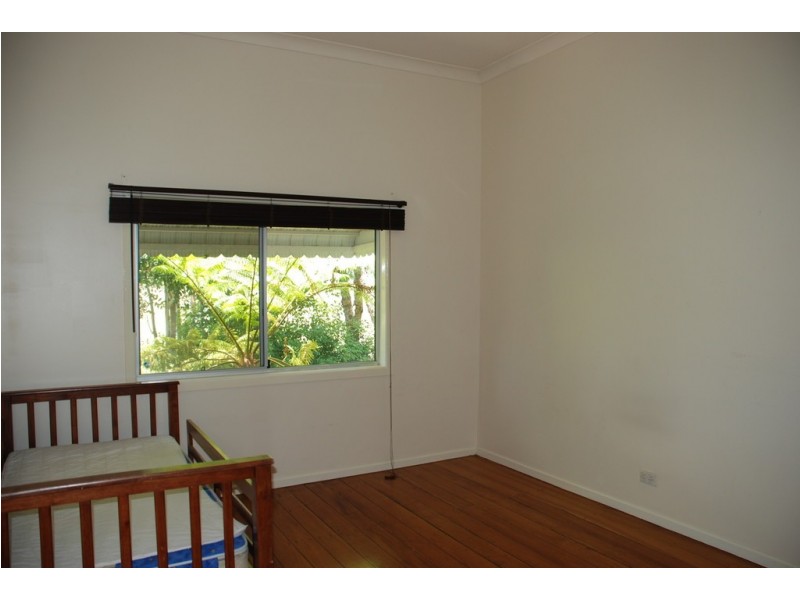
Peaceful Queenslander Style Home
$465,000
- Listing history:
- 18 Feb, 2014
- 8 Aug, 2015
- 1 Feb, 2016

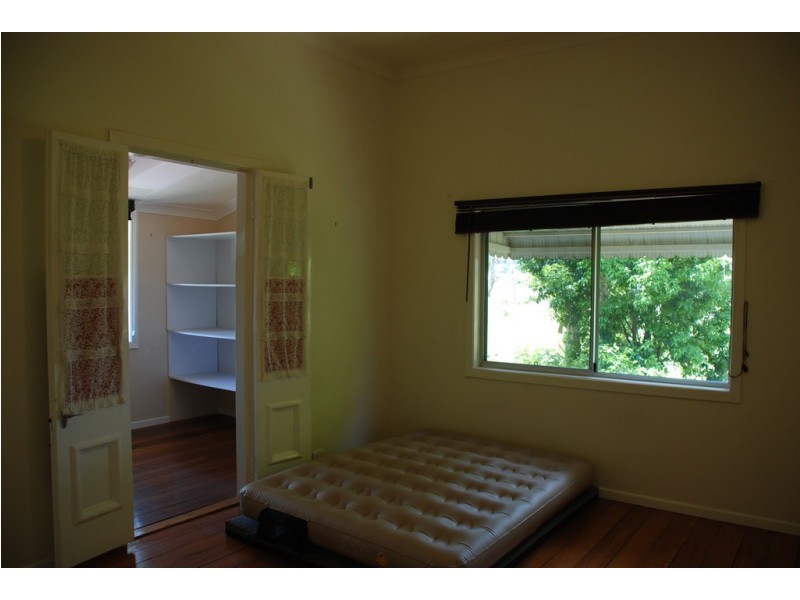
- 3
- 1
- 1
Peaceful Queenslander Style Home


Listing ID: 30622238