Listing ID: 38983818
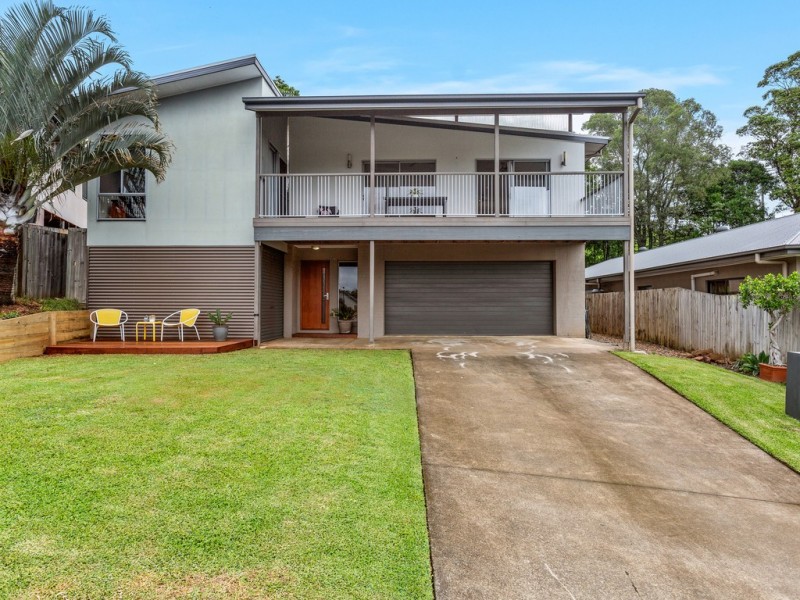
15 GOLD LEAF CRESCENT, Murwillumbah NSW 2484
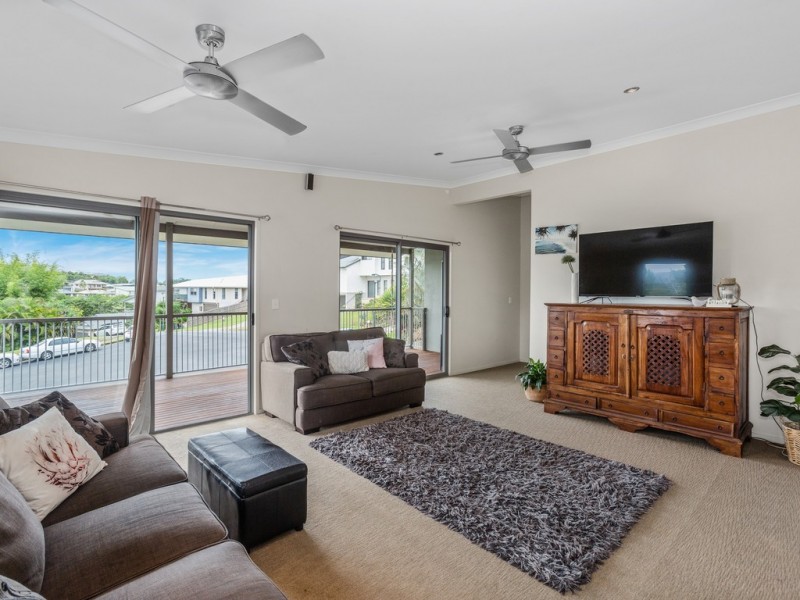
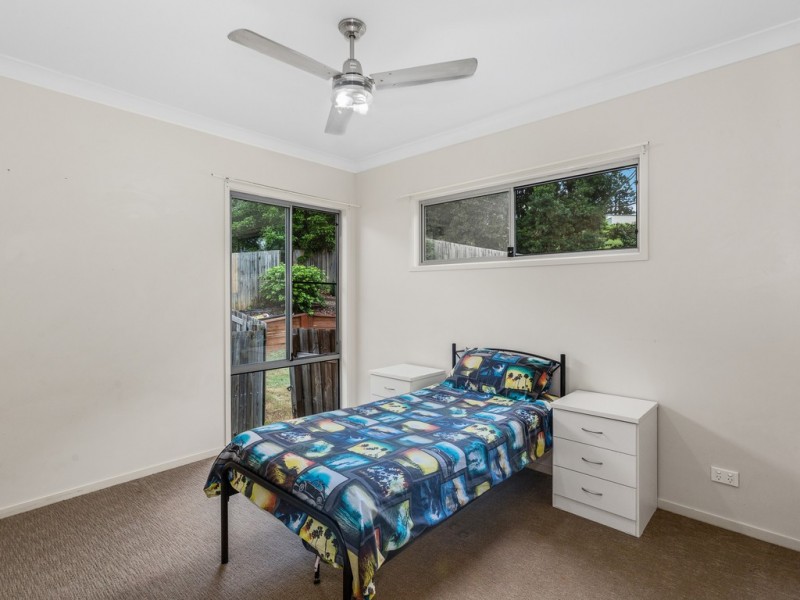
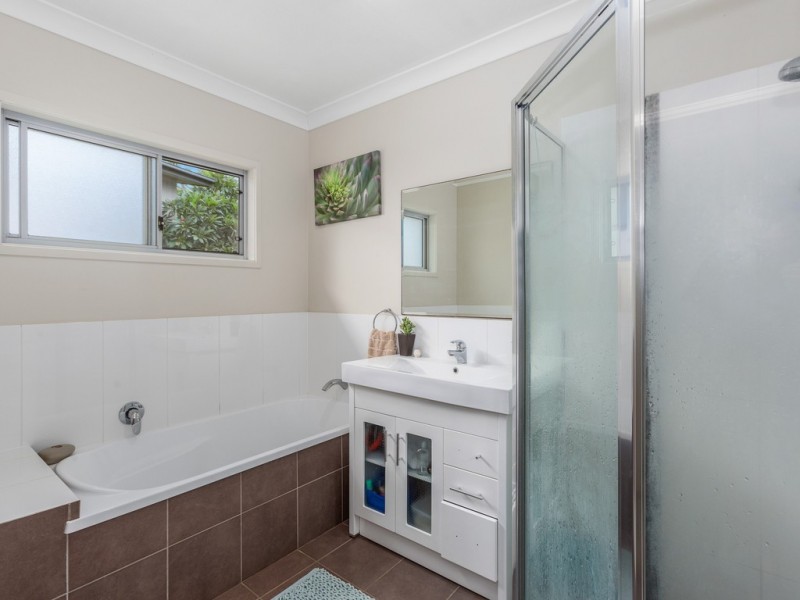
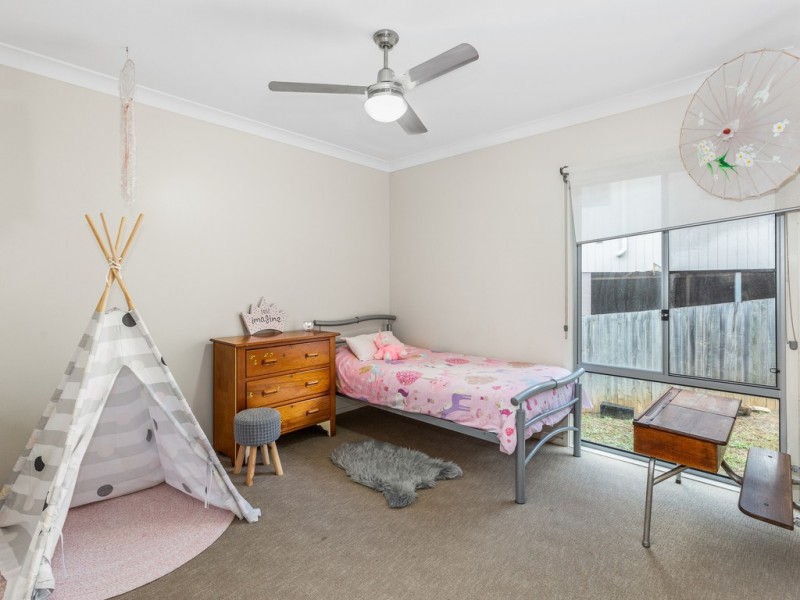
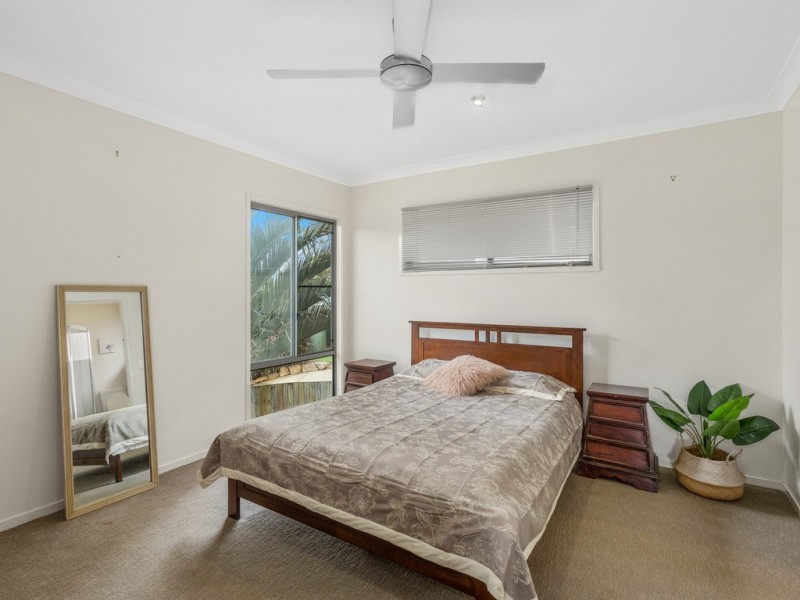
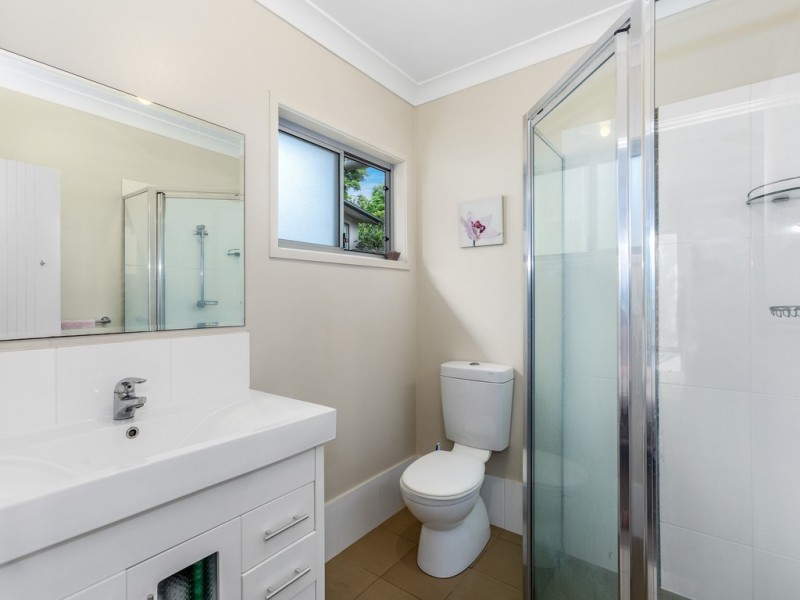
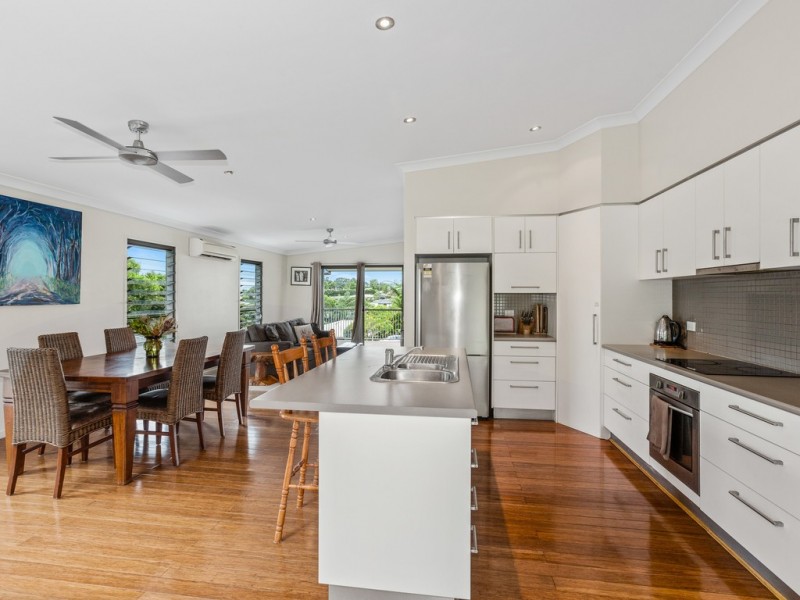
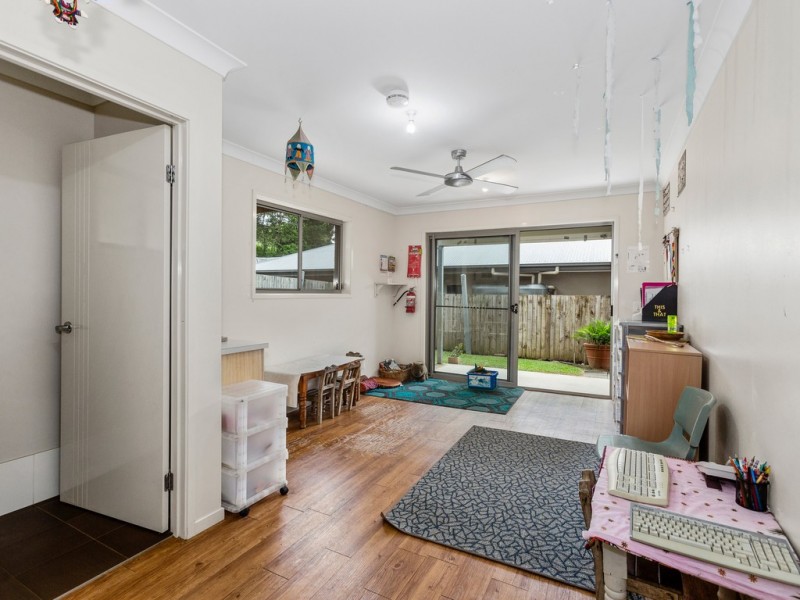
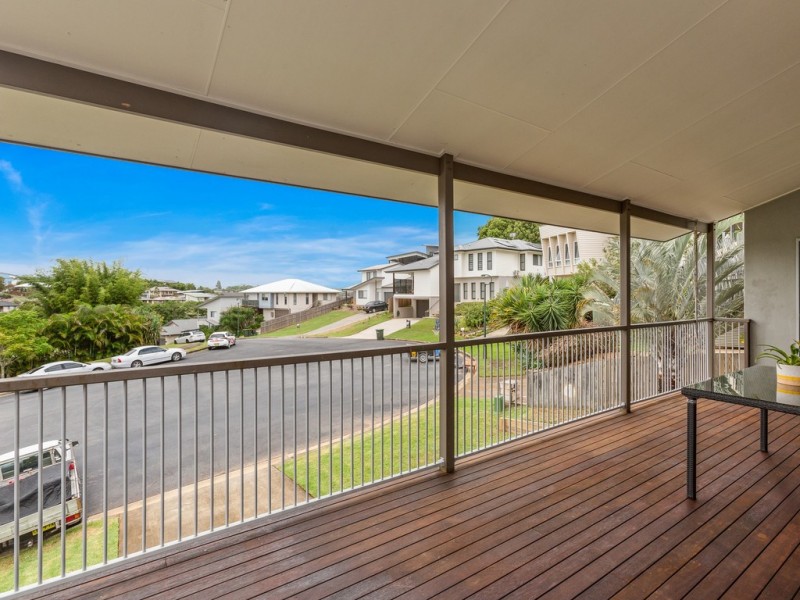
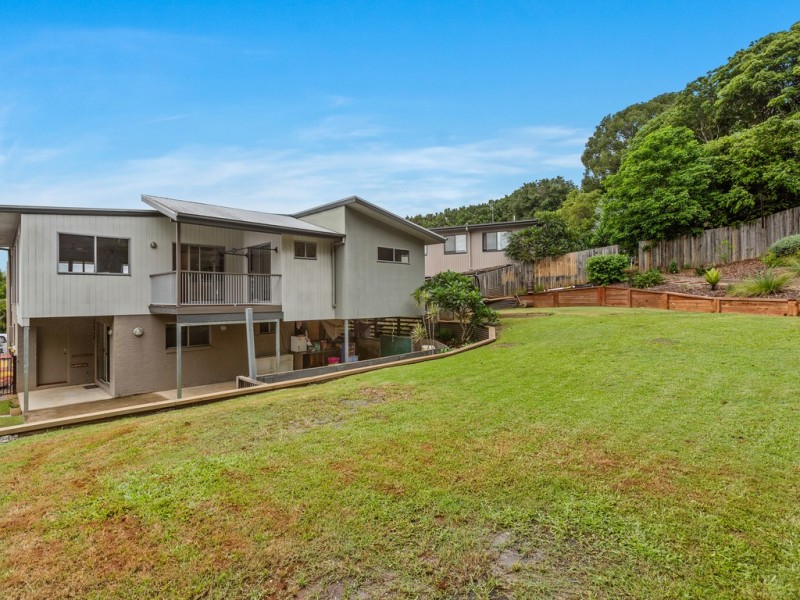
**DEPOSIT RECEIVED** Big and Beautiful
$585
- Listing history:
- 25 Feb, 2020
- 4 May, 2021

- 4
- 2
- 4
**DEPOSIT RECEIVED** Big and Beautiful


Listing ID: 38983818