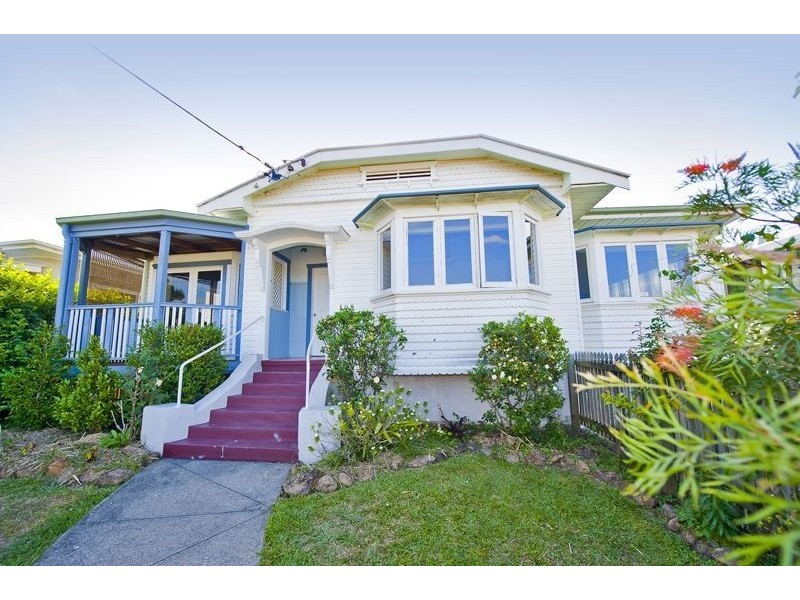
There are approximately 18,049 people living in Murwillumbah but… who are they?
44
49%
51%
Suburb Stats
$834/WK
$250/WK
$382/WK
Value of property in Murwillumbah and nearby suburbs
Murwillumbah
Caniaba
Arrawarra Headland
Byron Bay
Average Home Price$478,633Average Rental Price$346Household Size2.5
Average Home Price$542,321Average Rental Price$318Household Size2.4
Average Home Price$709,769Average Rental Price$472Household Size2.5
Average Home Price$1,200,682Average Rental Price$826Household Size2.3
Water Useper year per person
0.6mln. litres
State Average 0.74 mln. litres
Nat. Average 0.74 mln. litres
Greenhouse Pollutionper year per person
16.48tonnes
State Average 19.31 tonnes
Nat. Average 20.3 tonnes
Dwelling Types
91%
5%
3%
Most Common Suburb Professions
17% Professio…
15% Technicia…
14% Managers…
12% Labourers…
Nearby schools: murwillumbah high school, murwillumbah south infants school, murwillumbah east primary school, mt st patrick college
Nearby cafes: king street cafe, cenzo cafe, fish bowl cafe, dabelles cafe
Nearby doctors: kettle i h, king street medical centre-dr john moran, king street medical centre- dr. j. stephenson, king street medical centre-warne douglas
Nearby hospitals: murwillumbah district hospital, king street medical centre, queen street medical centre