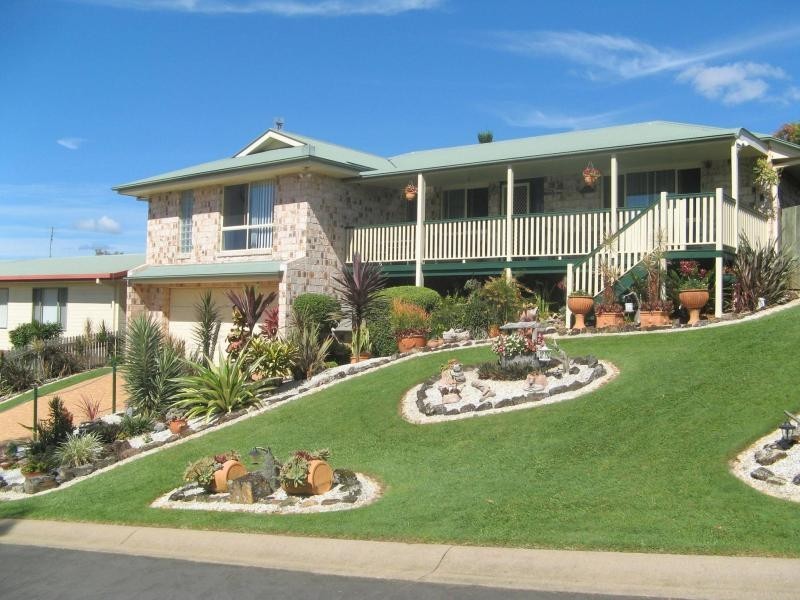
Murwillumbah NSW 2484 Award Winning Property $499,000 4 2 2 Listing ID: 12501733 Other properties for sale near Murwillumbah NSW 2484 11 Coral Fern Circuit, Murwillumbah NSW 2484 49 William Street, Murwillumbah NSW 2484 166 Murwillumbah Street, Murwillumbah NSW 2484 2/27 Tombonda Road, Murwillumbah NSW 2484 2/27 Tombonda Road, Murwillumbah NSW 2484 Location THIS PROPERTY WAS WITHDRAWN Enquiry about this property Name* Email* Phone* Message* Send me regular newsletters from Homehound Have agents get in touch about similar properties within the area What is 8 + 20?* Receive email alerts for properties like this Email alerts Email* Send me regular newsletters from Homehound. Have agents get in touch about similar properties within the area What is 8 + 20?*