Listing ID: 17290553
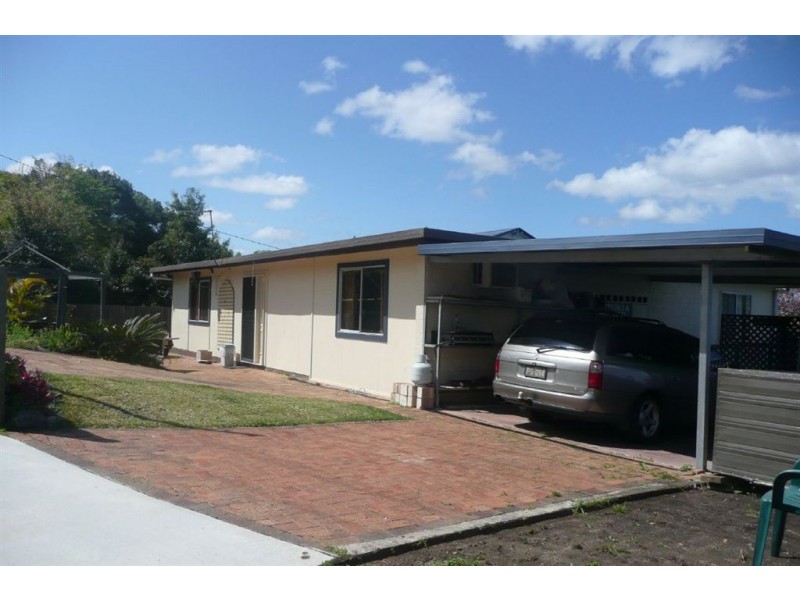
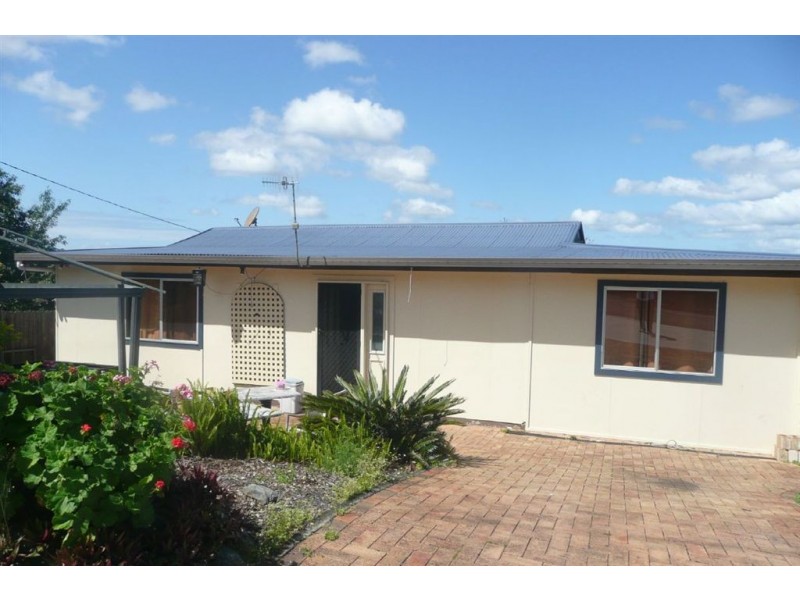
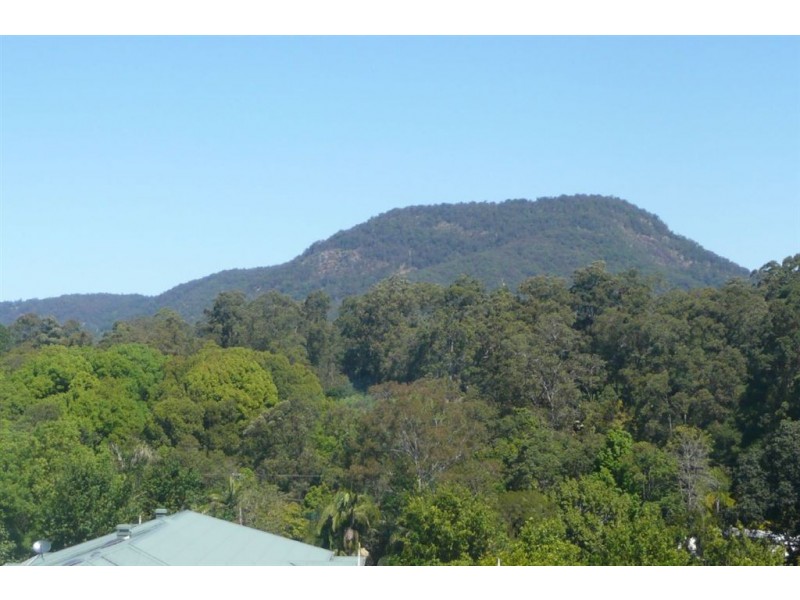
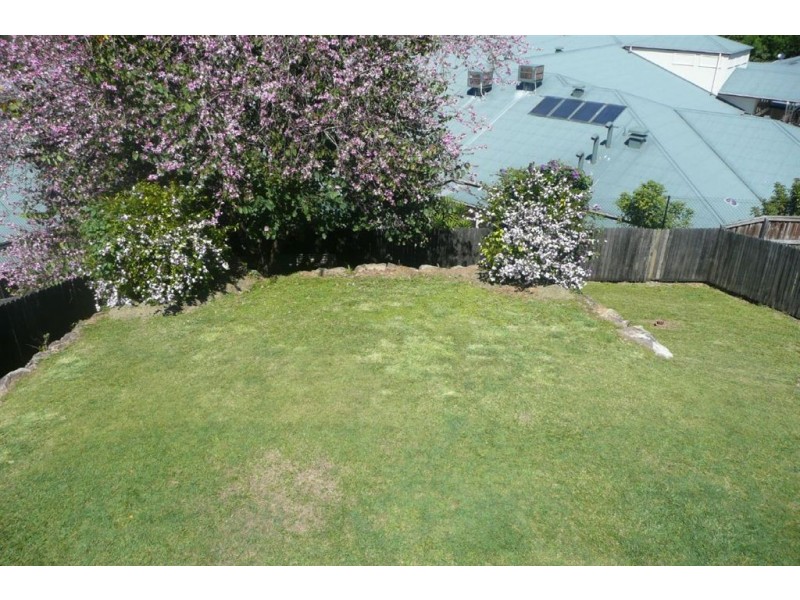
188 Byangum Road, Murwillumbah NSW 2484
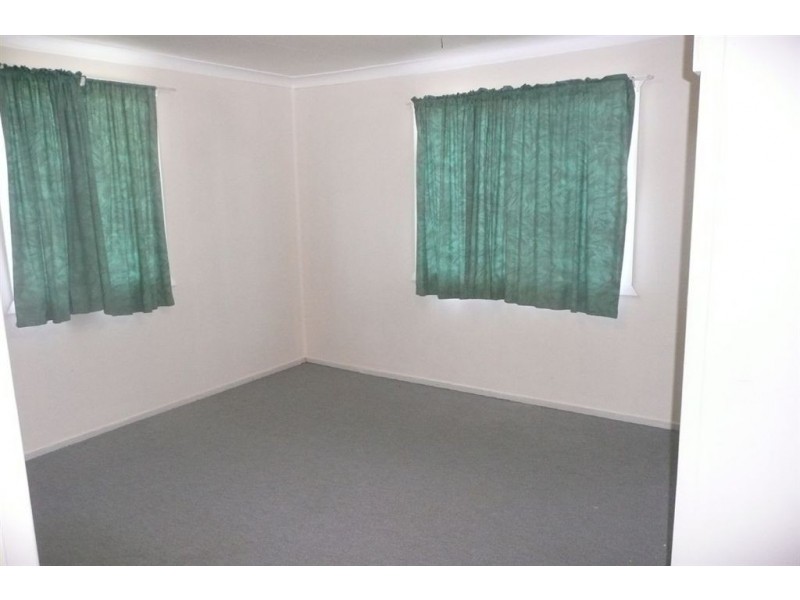
This one has plenty of space
$330
- Listing history:
- 29 Sep, 2011
- 25 Oct, 2011
- 7 Aug, 2013

- 3
- 2
- 1
This one has plenty of space


Listing ID: 17290553