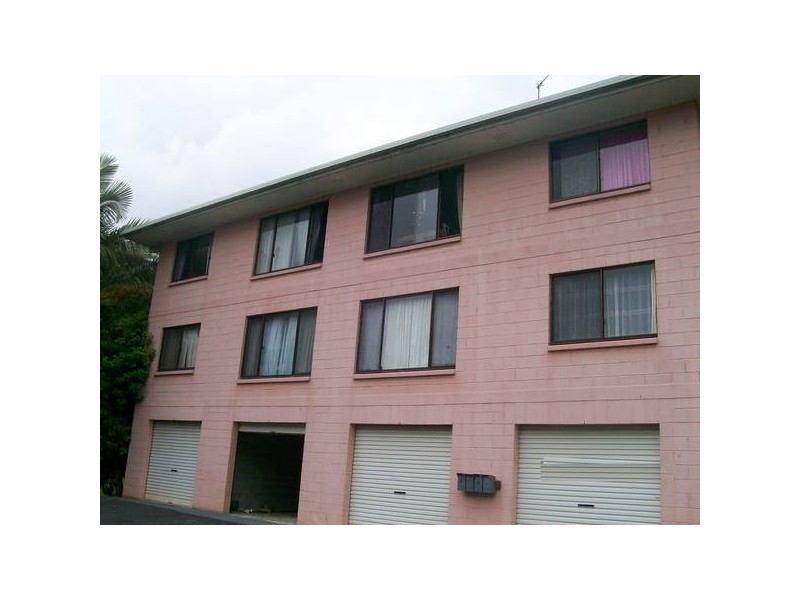
Murwillumbah NSW 2484 Walking Distance to CBD $190 per week 2 1 0 Listing ID: 4573376 Other properties to rent near Murwillumbah NSW 2484 3/25 Eyles Avenue, Murwillumbah NSW 2484 1/24 Joshua Street, Murwillumbah NSW 2484 2/8 Bagoo Ave, Murwillumbah NSW 2484 Cottage – 88 Bartletts Rd, Murwillumbah NSW 2484 3/5 Church Lane, Murwillumbah NSW 2484 Location THIS PROPERTY WAS LEASED Enquiry about this property Name* Email* Phone* Message* Send me regular newsletters from Homehound Have agents get in touch about similar properties within the area What is 8 + 20?* Receive email alerts for properties like this Email alerts Email* Send me regular newsletters from Homehound. Have agents get in touch about similar properties within the area What is 8 + 20?*