Listing ID: 24446648
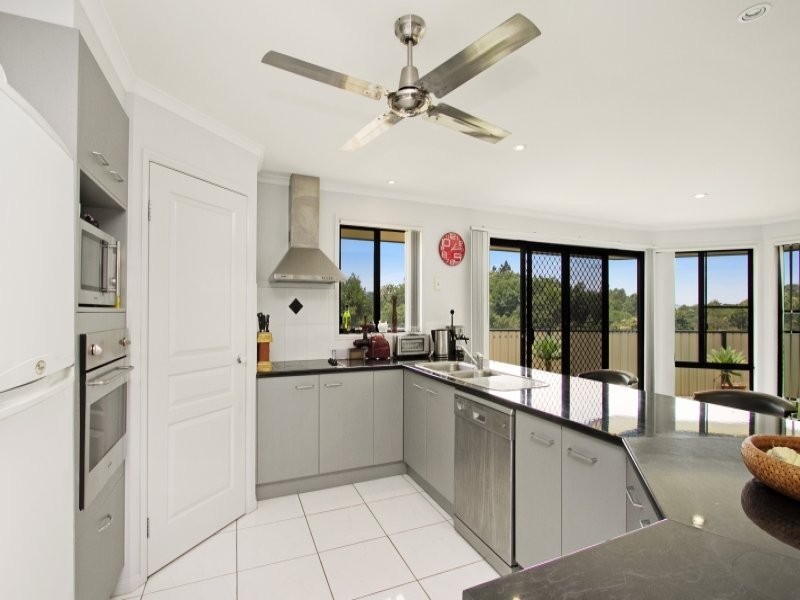
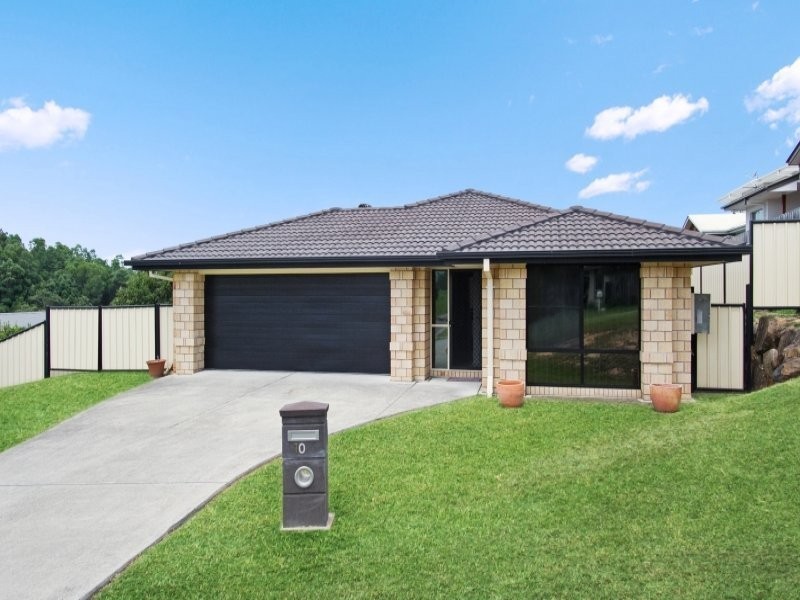
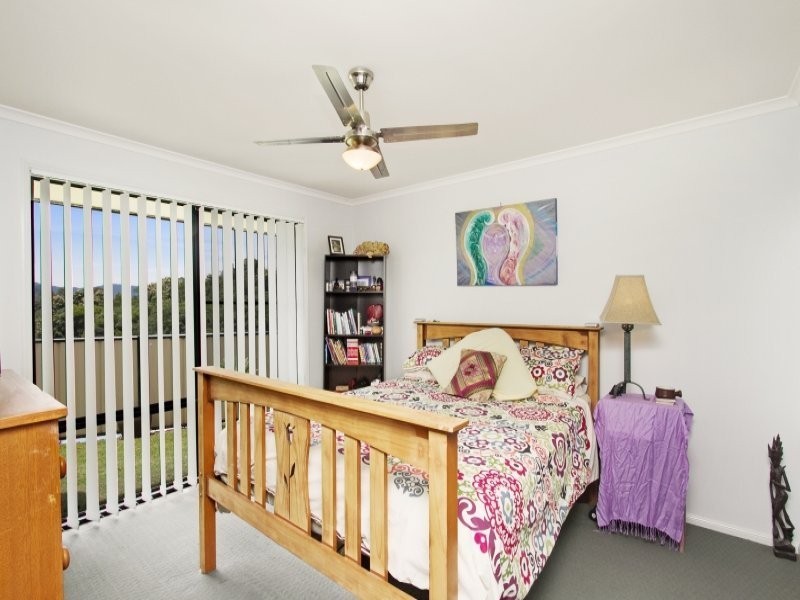
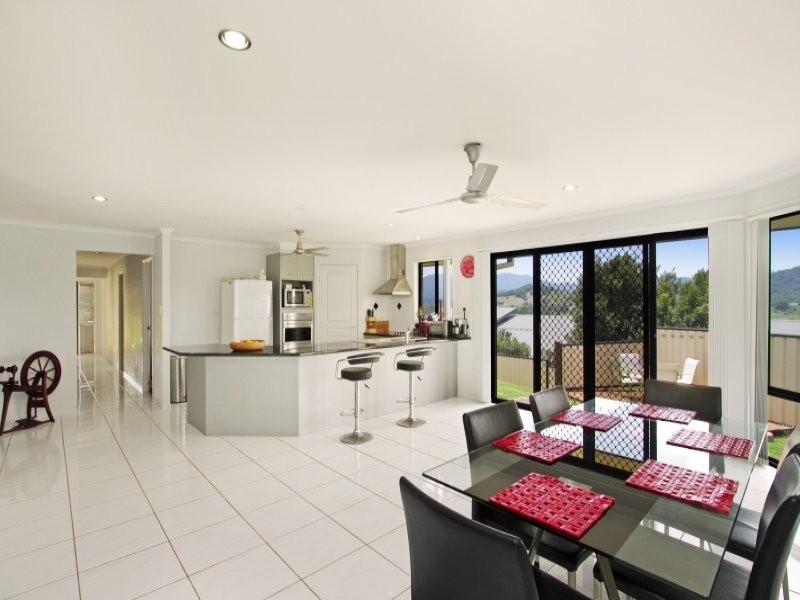
10 Saddle Way, Murwillumbah NSW 2484
Relocating And Moving All Assets!!!
$429,000
- Listing history:
- 25 Mar, 2011
- 5 Mar, 2013
- 12 Dec, 2013

- 4
- 2
- 2
Relocating And Moving All Assets!!!


Listing ID: 24446648