Listing ID: 20289268
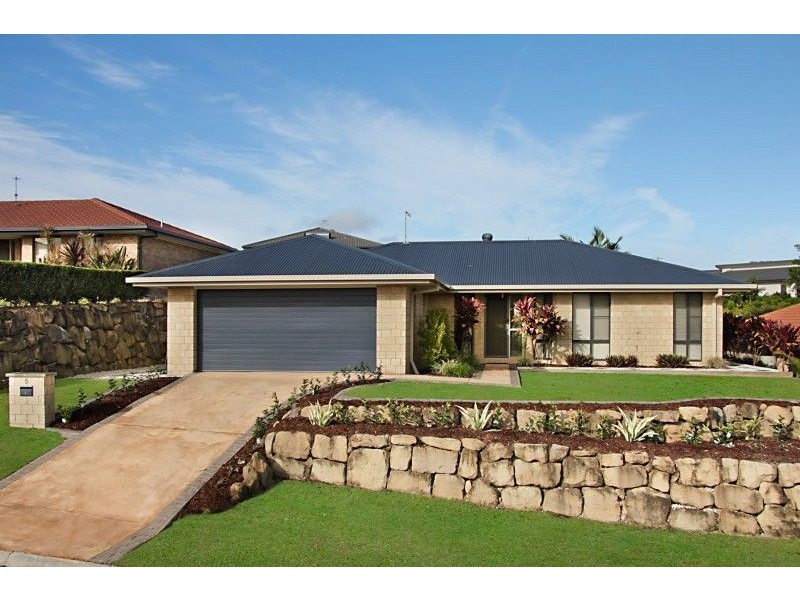
5 Mount Ballow Avenue, Murwillumbah NSW 2484
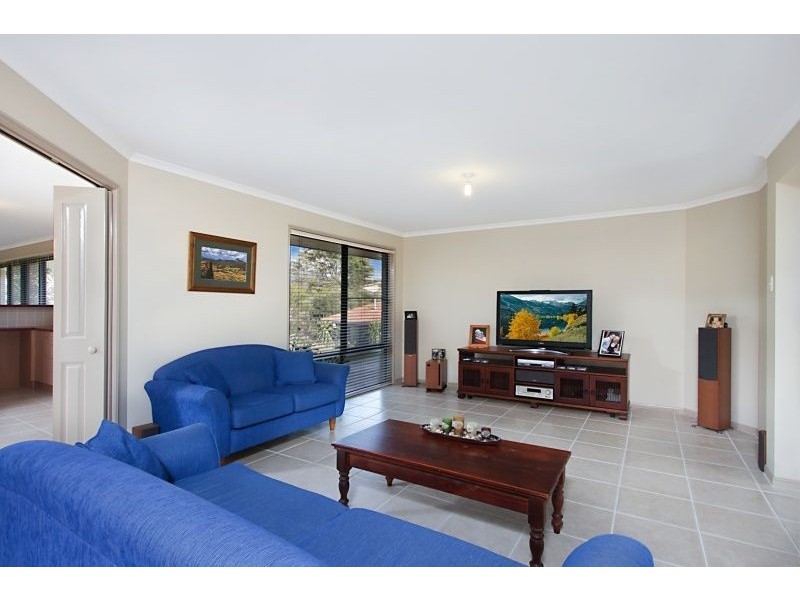
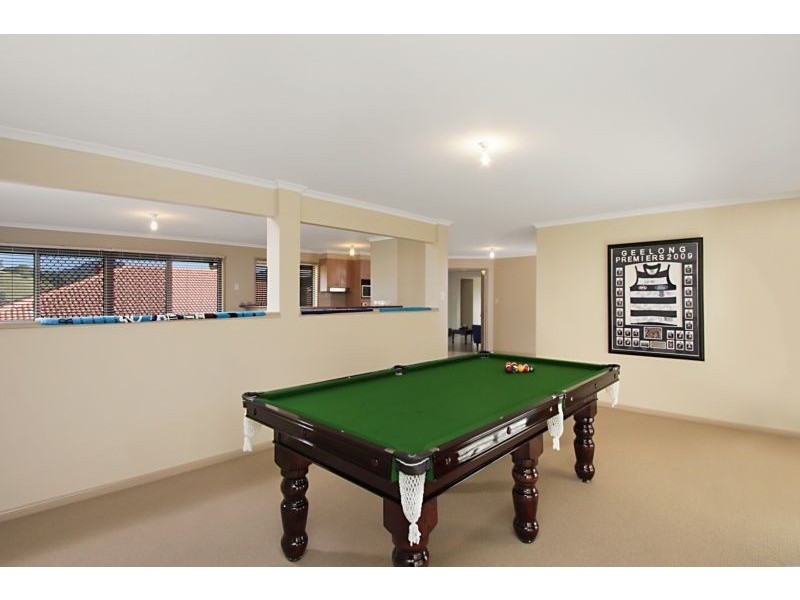
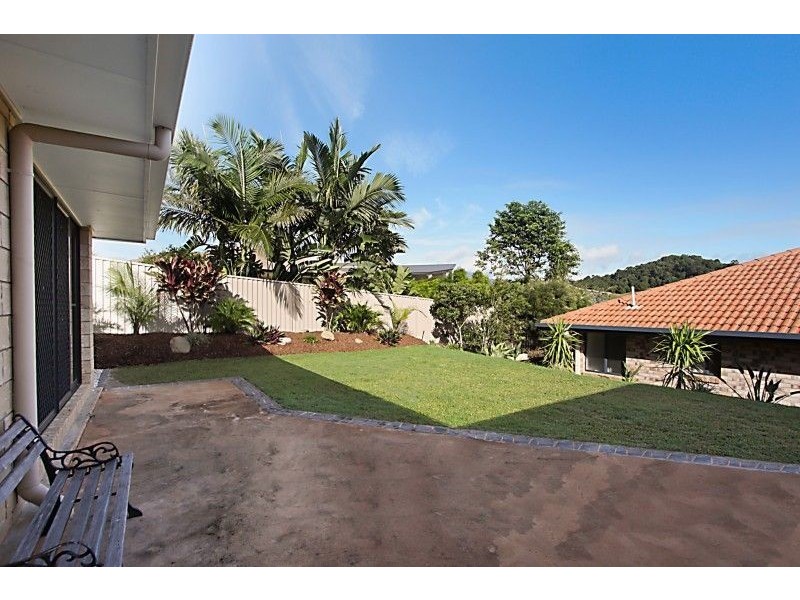
Is it space that you are after??
$445K-$475K By Neg.
- Listing history:
- 22 Aug, 2012

- 4
- 2
- 2
Is it space that you are after??


Listing ID: 20289268